Test results
Log output
Colors:
Blue: A firmware build or test has just started.
Green: A firmware build or a test has successfully finished.
Orange: A test has failed.
Red: There was an error.
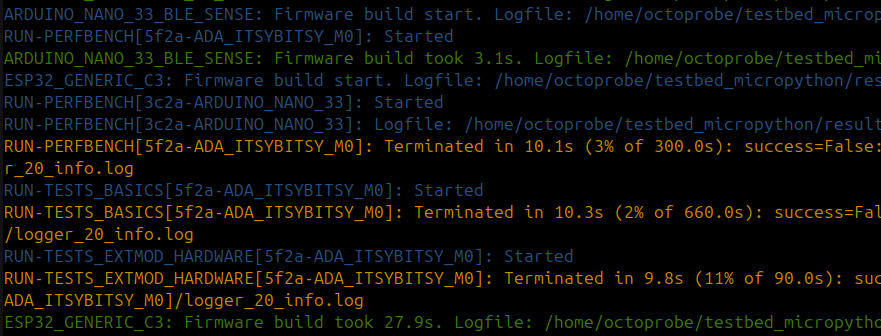
Note
Lines starting with ESP32_GENERIC_C3:: You see where the firmware build starts (blue) end ends (green).
Lines starting with RUN-PERFBENCH[5f2a-ADA_ITSYBITSY_M0]:: You see where the test starts (blue) and where it fails (orange).
python logging
We use python logging. There will always be written 3 files in parallel:
logger_10_debug.log # Contains logging.debug and above
logger_20_info.log # Contains logging.info and above
logger_40_error.log # Contains logging.error and above
You probably want to have a look at logger_40_error.log to know if an error happened. If yes, have a look at logger_20_info.log to see the error AND info messages. Etc.
Summary of test succeed / failed / skip / error
The is NO such summary yet.
Timing Report
The timing report is written in three formats: task_report.md / .txt / .html
Timing report gives an overview of the time axis. All tentacles should be used all the time. The latest tentacle is the bottleneck.
Columns mpbuild, A, B, C: These are the lockable resource.
Task a, b, c: These are the firmwares which have been build by the FirmwareBartender process.
Task 2(b,c): This is Task 2 which is using two tentacles with the firmware b and c.
This timing report is short and compact. The downside is, that you have too lookup the tantacles and tasks in the other tables.
Report input data: This is the raw input data which was used to build the Timing report.
Timing report
=============

start  duration  mpbuild       A     B       C
0.0s     +3.5s        a       .     .       .
3.5s     +7.5s        b       .  1(a)       .
11.0s     +1.0s        .  2(b,c)  1(a)  2(b,c)
12.0s     +0.5s        .  2(b,c)     .  2(b,c)
12.5s     +2.0s        c  2(b,c)  3(b)  2(b,c)
14.5s     +0.5s        c  4(b,c)  3(b)  4(b,c)
15.0s     +3.0s        c  4(b,c)     .  4(b,c)
18.0s     +1.0s        c       .     .       .
19.0s                  .       .     .       .

Legend: Tentacles
-----------------

Tentacle-ID  Tentacles
    mpbuild  mpbuild
        A  Lolin
        B  PICO
        C  PICO2

Legend: Tasks
-------------

Task-ID  Task               Tentacle                            Duration
    a  Build PICO2                                                3.5s
    b  Build PICO2-RISCV                                          7.5s
    c  Build ESP8266                                              6.5s
    1  Test X             PICO(PICO2)                             8.5s
    2  Test Test X        PICO2(PICO2-RISCV), Lolin(ESP8266)      3.5s
    3  Test Y             PICO(PICO2-RISCV)                       2.5s
    4  Test Test Y        PICO2(PICO2-RISCV), Lolin(ESP8266)      3.5s

Report input data
-----------------

Start    End  Duration  Task               Tentacles
0.0s   3.5s      3.5s  Build PICO2
3.5s  11.0s      7.5s  Build PICO2-RISCV
3.5s  12.0s      8.5s  Test X             PICO(PICO2)
11.0s  14.5s      3.5s  Test Test X        PICO2(PICO2-RISCV), Lolin(ESP8266)
12.5s  15.0s      2.5s  Test Y             PICO(PICO2-RISCV)
12.5s  19.0s      6.5s  Build ESP8266
14.5s  18.0s      3.5s  Test Test Y        PICO2(PICO2-RISCV), Lolin(ESP8266)
mpbuild build results
There is a folder for every firmware variant.
docker_stdout.txt is the output of the mpbuild docker container and may be followed in real time (tail -f docker_stdout.txt).
├── mpbuild
│   ├── ESP32_GENERIC_S3
│   │   ├── docker_stdout.txt
│   │   ├── firmware.bin
│   │   ├── firmware.spec
│   │   ├── logger_10_debug.log
│   │   ├── logger_20_info.log
│   │   └── logger_40_error.log
│   ├── RPI_PICO2
│   │   ├── docker_stdout.txt
│   │   ├── firmware.spec
│   │   ├── firmware.uf2
│   │   ├── logger_10_debug.log
│   │   ├── logger_20_info.log
│   │   └── logger_40_error.log
│   ├── RPI_PICO2-RISCV
│   │   ├── docker_stdout.txt
│   │   ├── firmware.spec
│   │   ├── firmware.uf2
│   │   ├── logger_10_debug.log
│   │   ├── logger_20_info.log
│   │   └── logger_40_error.log
RUN-xxx test results
There is a folder for every testgroup. A testgroup is one call of run-tests.py which is uniquly identified by the testid.
The testid is:
RUN-MULTITESTS_MULTIBLUETOOTH: The name of the test.
,a: If –count=3 this will be ,a, ,b and ,c.
1830-LOLIN_C3_MINI: The tentacle under test. 1830 is the tentacle serial number.
-first / -second: Tests with MULTI in there name defines roles, for example -first for WLAN-STA and -second for WLAN-AP.
testresults.txt is the output of the testprogram and may be followed in real time (tail -f testresults.txt).
├── RUN-MULTITESTS_MULTIBLUETOOTH,a@1830-LOLIN_C3_MINI-first
│   ├── logger_10_debug.log
│   ├── logger_20_info.log
│   ├── logger_40_error.log
│   └── testresults.txt
├── RUN-MULTITESTS_MULTIBLUETOOTH,a@1830-LOLIN_C3_MINI-second
│   ├── logger_10_debug.log
│   ├── logger_20_info.log
│   ├── logger_40_error.log
│   └── testresults.txt
├── RUN-PERFBENCH,a@2731-RPI_PICO2-RISCV
│   ├── flashing_stout.txt
│   ├── logger_10_debug.log
│   ├── logger_20_info.log
│   ├── logger_40_error.log
│   └── testresults.txt
├── RUN-PERFBENCH,a@2731-RPI_PICO2
│   ├── flashing_stout.txt
│   ├── logger_10_debug.log
│   ├── logger_20_info.log
│   ├── logger_40_error.log
│   └── testresults.txt